
Project background: from isolated alarms to continuous risk assessment
Fiber-optic safety monitoring for data-center power distribution and equipment rooms addresses the long-term safety and condition management of data-center high- and low-voltage distribution, busways, cable spaces, UPS battery areas, cold aisles, racks and cooling-water systems. Such assets commonly span multiple spaces, process sections or asset identifiers; risks can move along routes, equipment boundaries and structural weaknesses rather than appearing at predetermined measuring points. Key concerns include heating at dense electrical connections, loose busway joints, battery-area thermal anomalies, cooling imbalance, water leakage and vibration changes in critical equipment. Point sensors, manual inspections and video provide local evidence but may not capture the complete development of an anomaly from onset to response.
The solution uses DTS, FBG and silicon-photonic sensors, placing sensing fiber along the paths that need observation to create continuous, localized and replayable records. Its objective is to combine power-system temperature, sensitive point measurements and environmental conditions in one asset view to detect and track localized anomalies early, rather than add isolated equipment. Start design with an asset-risk inventory and verifiable monitoring objectives, then specify range, spatial resolution, sampling, sensing-cable construction, software interfaces and alarms.
Risk progression and monitoring boundaries
For data-center high- and low-voltage distribution, busways, cable spaces, UPS battery areas, cold aisles, racks and cooling-water systems, distinguish initiating factors, early signs, developing conditions and consequences. Risks including heating at dense electrical connections, loose busway joints, battery-area thermal anomalies, cooling imbalance, water leakage and vibration changes in critical equipment may occur independently or arise from combined load, environmental, construction and maintenance effects. Capture measurable changes in temperature, acoustics, vibration, strain or local condition and associate them with specific assets and distances.
Sensing principles and technology selection
An integrated solution places continuous DTS temperature, dynamic DAS acoustics/vibration, slow BOTDA/BOTDR strain and sensitive FBG or silicon photonic point measurements in one spatial coordinate system. Different mechanisms provide complementary evidence: temperature indicates thermal anomalies; acoustics/vibration describes event timing and dynamics; strain reveals cumulative structural change; and point sensors add local equipment condition.
The recommended combination is DTS, FBG and silicon-photonic sensors. Check monitoring distance, spatial resolution, localization accuracy, channel count, dynamic range, sampling cycle, operating temperature and communications together. Specifications should support the objective to combine power-system temperature, sensitive point measurements and environmental conditions in one asset view to detect and track localized anomalies early, rather than be compared individually. For long routes, prioritize signal-to-noise ratio, reliable localization and far-end stability; for localized high-risk areas, assess coupling, effective sensing length and response time.
System architecture: sensing, interrogation, software and response
The system comprises sensing cable or fiber sensors, splicing and protection units, interrogation equipment for DTS, FBG and silicon-photonic sensors, edge processing, application software and supervisory interfaces. Returned signals undergo quality checks, distance calibration and parameter calculation before mapping to asset records. Outputs include live curves, time-space plots, event lists, risk zones, historical trends and reports, rather than an unexplained waveform.
Coordinate with DCIM, infrastructure monitoring, BMS and alarm work-order systems for room-plan location, trend reporting and maintenance closure. Define the data dictionary, time synchronization, alarm acknowledgment, offline buffering and recovery upload. For important projects, use tiered retention of raw or feature data to support incident reviews, algorithm improvement and threshold changes.
Sensing cable and field installation
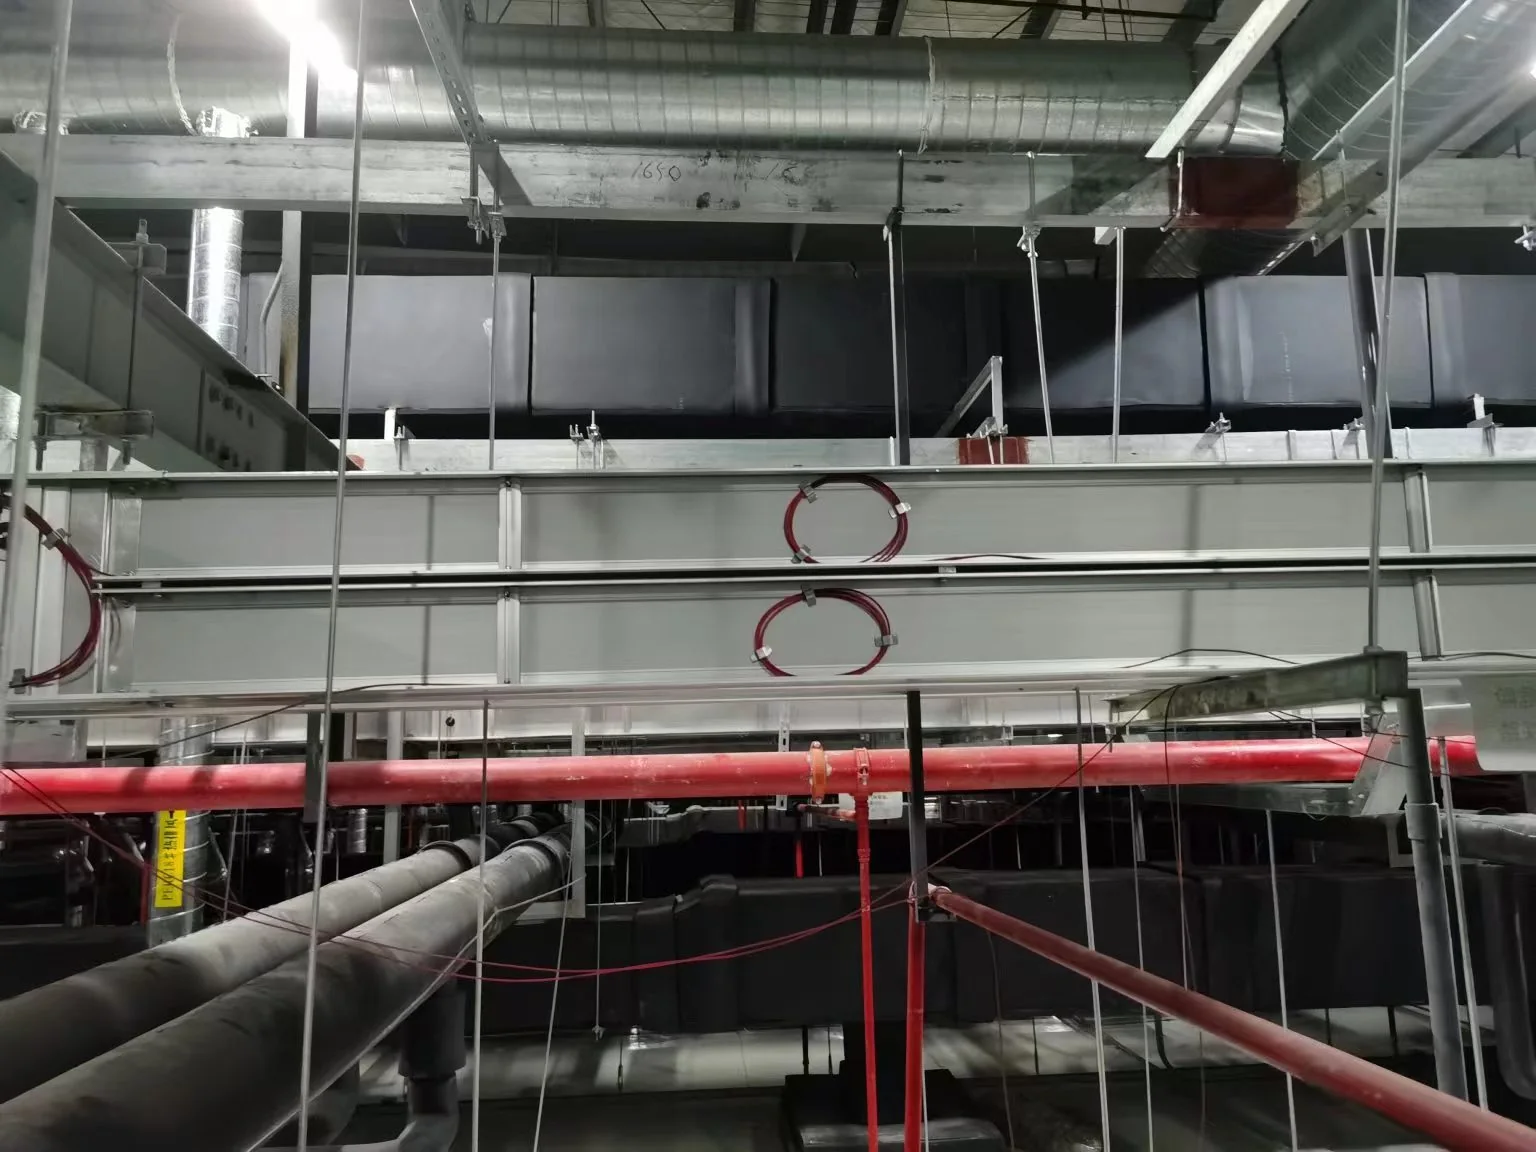
Recommended installation: cover cable and busway routes with DTS, place FBG or silicon-photonic sensors at busbar joints, pumps and special positions, and model rooms and racks spatially. Installation quality directly affects results; the same interrogator can respond differently with different mounting, jacket materials and coupling. Design documents should identify start/end distances, slack loops, splice boxes, zone boundaries, fastening intervals, bend radius, pulling tension and protection.
Data analysis and graded alarms
Instead of simply connecting several interrogators, establish unified distance coordinates, asset identifiers and timestamps. Validate data quality within each parameter before cross-checking between parameters. For example, coincident acoustic/vibration and temperature anomalies may increase risk priority; a short impact without subsequent temperature or strain change can enter observation or manual verification.
Initial application criteria: establish load-related temperature-rise baselines and verify alarms using neighboring-circuit comparisons, daily trends and equipment events. Use advisory, early-warning, alarm and emergency levels, each with defined confirmation times, verification and actions. Calibrate thresholds against actual conditions during trial operation and record every revision, reason and effective date. Display position, asset name, measured value, baseline deviation, duration and supporting evidence together.
Commissioning, acceptance and performance verification
Integrated acceptance must verify each sensing chain and test clock synchronization, distance mapping, asset identifiers and response logic across systems. Simulated events should cover individual and simultaneous multi-parameter anomalies, communication loss and sensing-cable faults, confirming clear indications during degraded operation.
Maintenance and sustained effectiveness
Maintenance assessment should cover valid-alarm rates, confirmation time, false-alarm causes, missed-event reviews, closed work orders and detected trends, not just equipment uptime. Continued labeling of real events can improve recognition models and sustain practical performance after commissioning.
Integration with existing systems
Coordinate with DCIM, infrastructure monitoring, BMS and alarm work-order systems for room-plan location, trend reporting and maintenance closure. Let the fiber platform handle interrogation, curve analysis and original evidence, while the supervisory system manages consolidated displays, duty workflows and work orders. Depending on the project, interfaces may use Modbus TCP, OPC UA, IEC protocols, REST APIs, message queues or dry contacts. Avoid transferring only an unexplained aggregate alarm.
Every alarm on a map, plan or process diagram should link back to original curves and historical trends. Feed dispositions from supervisory systems back into event records, closing the loop between monitoring, confirmation, response, review and threshold improvement.
Benefits, operating conditions and technical boundaries
The solution replaces sampled inspections of data-center high- and low-voltage distribution, busways, cable spaces, UPS battery areas, cold aisles, racks and cooling-water systems with continuous observation, retaining traceable early indications of heating at dense electrical connections, loose busway joints, battery-area thermal anomalies, cooling imbalance, water leakage and vibration changes in critical equipment. Passive fiber, electromagnetic immunity and multiple sensing locations on one fiber can reduce distributed power and maintenance requirements on long routes, at unattended sites or in hazardous environments. Locations and trends help teams narrow inspections, plan condition-based maintenance and prioritize risk.
Equipment selection and detailed design
Begin with five questions: which parts of data-center high- and low-voltage distribution, busways, cable spaces, UPS battery areas, cold aisles, racks and cooling-water systems require protection; which indications of heating at dense electrical connections, loose busway joints, battery-area thermal anomalies, cooling imbalance, water leakage and vibration changes in critical equipment must be detected; what localization, response and sampling performance is needed; what routing, power, communications and cabinet facilities are available; and who confirms alarms and owns the response workflow?
Then specify the combination of DTS, FBG and silicon-photonic sensors, cable construction, single- or double-ended optical paths, channel redundancy, software licensing and interfaces. For phased projects, reserve fiber, rack space, network addresses and platform capacity. For long-distance or multisite projects, evaluate centralized interrogation, distributed edge nodes and remote maintenance together.
Application-specific validation and limitations
Data-center power chains cross several maintenance boundaries. Name busway sections, branch tap-off boxes, UPS areas and incoming feeders separately and associate them with rack or distribution-unit identifiers. Local connection monitoring requires adequate space and insulation; compare abnormal temperature with branch load and similar neighboring joints.
Display cold-aisle air temperature separately from electrical-connection temperature to avoid misleading shared color thresholds. Switching, load migration and HVAC maintenance can change baselines; work orders should annotate these states. At acceptance, trace a complete chain to confirm agreement among field positions, interrogator channels, platform assets and alarm recipients.
Installation, optical-path calibration and acceptance checklist
Related products and technical resources
Explore the product categories below according to distance, spatial resolution, channels, response and site conditions. Published specifications support preliminary selection; final configuration must account for optical loss, installation and acceptance objectives.
Related equipment and specifications
Select the final model and installation to suit project conditions.
DTS-BLY-5S(ADV-10km)
Multimode 10 km DTS
DAS-UL10(A30) / (A70)
Generation 4.5 engineering DAS
BLY-SOACC-3-XXX
Three-axis silicon photonic accelerometer
BLY-SOACS-1-XXX
Fiber-optic acoustic signature sensor
BLY · DTS / DAS / BOTDA / BOTDR
BLY sensing cables
Related field cases
- Hangzhou Building J data-center cable monitoring
- Lenovo Saudi Arabia factory busbar safety monitoring
- Industrial power busbar temperature monitoring